
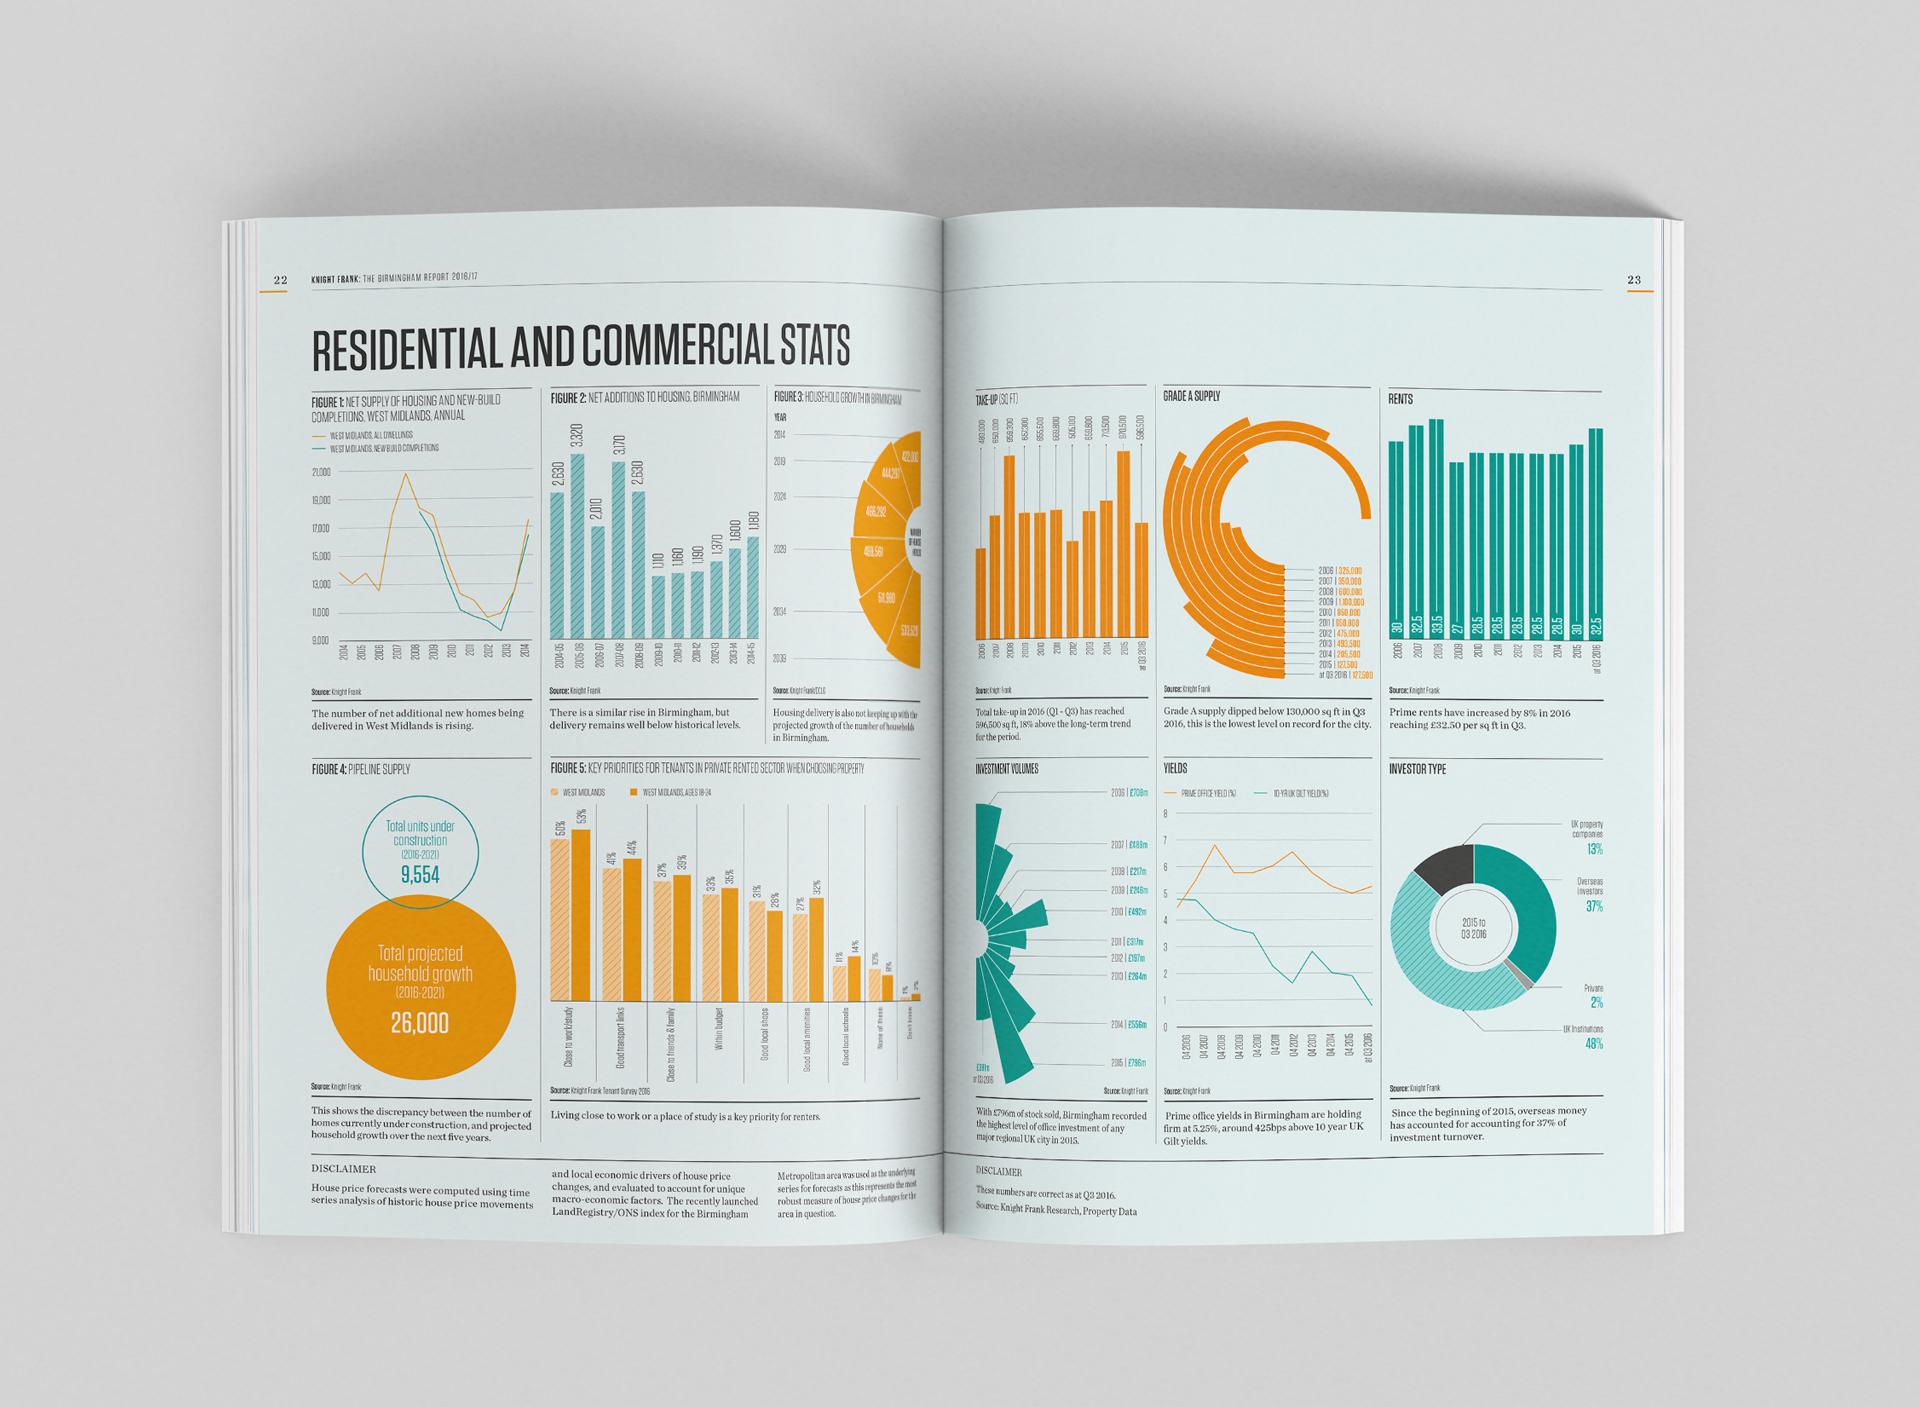
Infographics & Business Report Design
Businesses generate large volumes of information, but communicating that information effectively can be challenging. Complex data, business processes, and performance results often require more than text and spreadsheets to make them understandable.
Our Infographics and Business Report Design services transform information into clear, structured, and visually engaging communication materials.
We combine data visualization principles, graphic design, and content organization to help businesses communicate important insights effectively.
Whether you need an annual report, business performance presentation, process infographic, statistical summary, or corporate report, we develop layouts that simplify information while preserving its meaning.
Our designs focus on visual hierarchy, chart readability, typography, appropriate color usage, and consistent presentation.
We work with content such as business metrics, financial summaries, operational reports, research findings, and organizational processes.
Our objective is to make complex information easier to interpret and present it in a professional format suitable for internal teams, leadership, customers, and stakeholders.
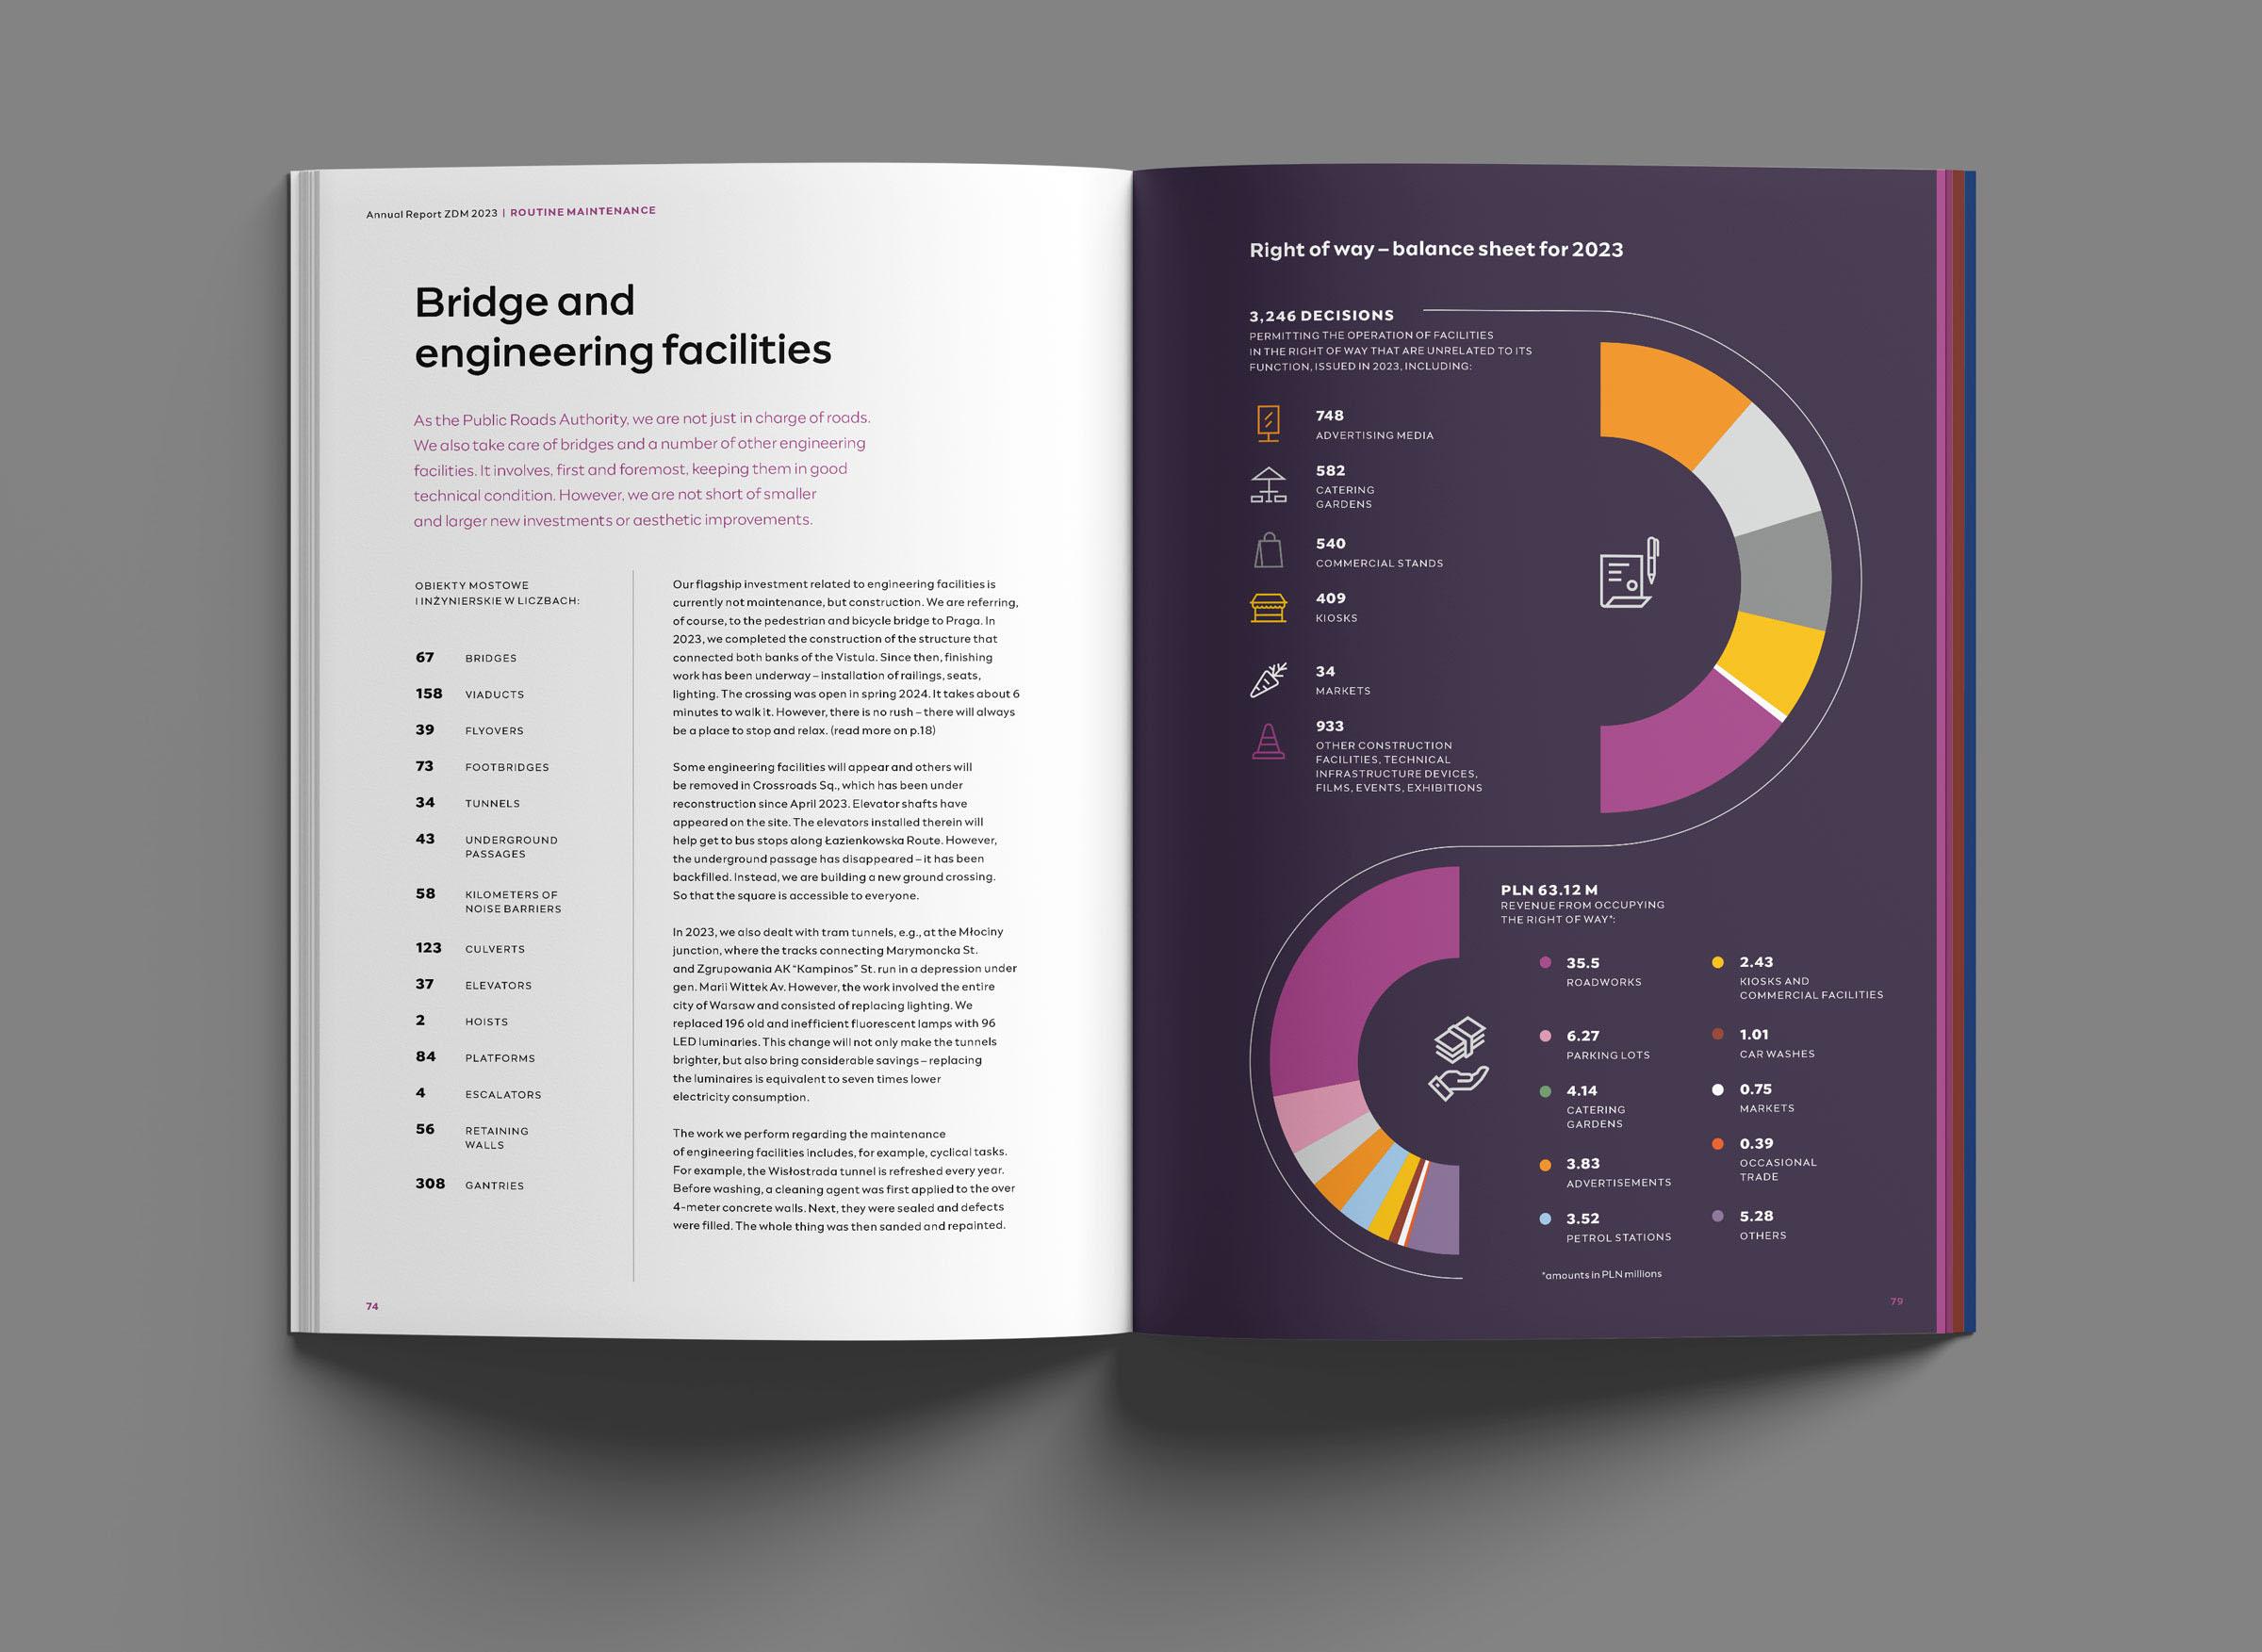
Why Visual Communication of Data Matters
Effective information design helps audiences identify important insights and understand relationships between different data points.
Our information design services include:
-
Business infographics
-
Annual report design
-
Corporate performance reports
-
Financial summary layouts
-
Charts and graph design
-
Process flow diagrams
-
Timeline infographics
-
Research report layouts
-
Executive dashboards
-
Data-driven presentation graphics
Our process begins by understanding the information, its purpose, and the audience that needs to interpret it.
We organize content into logical sections and identify suitable visual formats for different types of information.
Charts, diagrams, timelines, and infographics are selected based on the nature of the data and the message being communicated.
We prioritize accuracy, readability, and consistency, avoiding unnecessary decorative elements that could distract from the information.
Through careful typography, spacing, and visual hierarchy, we create reports and infographics that support clearer business communication and more effective presentations.